

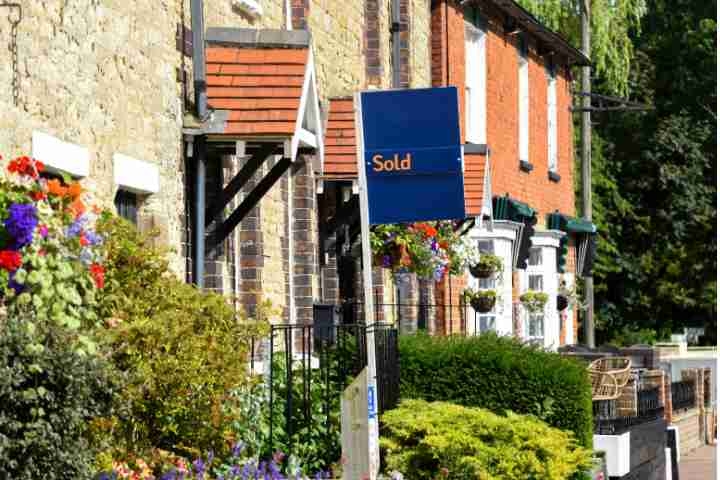
A new study has revealed that the UK average house price has risen by 231.1% since 2000, with this rise equating to 69.4% when accounting for inflation.
The study by consumer finance guide Låneguiden.se analysed data from the HM Land Registry UK House Price Index, comparing average house prices in every local authority in England and Wales inJune 2000 and June 2026. This identified the percentage difference in prices, with this known as the “nominal change” in the study.
The “real change” was also calculated after deflating by the Consumer Price Index (CPI). This indicatesthe price increase when accounting for inflation. These figures ranked areas with the highest and lowest increase rates.
Jakob Thorselius, Editor of Låneguiden.se, commented: “Every local authority area experienced a nominal and real increase in house prices in the last 26 years. While a nominal increase would be expected, it is a stark fact that every area experienced an increase of at least 40% when calculations allowed for inflation.
“The average UK house price has risen around 3.3 times in the first quarter of the 21st century, and with inflation figures not keeping in line, the figures depict the challenges homebuyers face in today’s market.
“Interestingly, our findings revealed that it is North West areas that have seen the greatest increases, while the South East have seen the lowest. This somewhat turns the assumption on its head that the North is more affordable. While prices are lower in many top-ranking areas, the rate at which prices are increasing is almost triple in some locations.”
Table: England and Wales local authorities with the highest increase in house prices
| Rank | Local authority | Average price June 2000 |
Average price June 2026 |
Nominal change | Real change (CPI) |
| 1 | Manchester | £41,071 | £251,250 | 511.7% | 213.0% |
| 2 | Salford | £42,180 | £231,890 | 449.8% | 181.2% |
| 3 | Oldham | £40,807 | £214,850 | 426.5% | 169.3% |
| 4 | Bolsover | £37,493 | £188,025 | 401.5% | 156.6% |
| 5 | Rhondda Cynon Taf | £33,964 | £167,559 | 393.3% | 152.4% |
| 6 | Waltham Forest | £107,563 | £522,743 | 386.0% | 148.6% |
| 7 | Leicester | £47,343 | £228,618 | 382.9% | 147.0% |
| 8 | Bury | £49,583 | £238,446 | 380.9% | 146.0% |
| 9 | Trafford | £82,549 | £396,811 | 380.7% | 145.9% |
| 10 | Tameside | £44,030 | £211,304 | 379.9% | 145.5% |
According to the analysis, Manchester house prices had the steepest climb in England and Wales since the start of the century. In June 2000, the average house price in Manchester was £41,071, and in June 2026, the average was £251,250. This is a nominal change of 511.7% and a real change of 213%when considering inflation.
Salford ranks second with a nominal change of 449.8% (181.2% with CPI). This is based on average prices rising from £42,180 to £231,890 over the 26 years.
Oldham ranks third, with the study identifying that house prices in the area grew by a nominal change of 426.5% (169.3% with CPI) when comparing 2000 and 2026 prices.
Fourth is Bolsover, Derbyshire, where house prices have risen from £37,493 in June 2000 to £188,025 in June 2026. This is a nominal change of 401.5% (156.6% with CPI).
Rhondda Cynon Taf ranks fifth overall and tops the list in Wales as the area with the highest house price increase. The nominal change was calculated as 393.3% (152.4% with CPI), rising from £33,964 to £167,559 over 26 years.
The London borough of Waltham Forest ranks sixth, with a nominal change of 386.0% (148.6% with CPI), based on an average price increase from £107,563 to £522,743.
Seventh is Leicester, where the average house price had a nominal change of 382.9% (147.0% with CPI) between June 2000 and June 2026.
Other Greater Manchester local authority areas, Bury (380.9% nominal change), Trafford (380.7% nominal change), and Tameside (379.9% nominal change), round out the top ten areas in England and Wales with the highest house price increases.
Table: England and Wales local authorities with the lowest increase in house prices
| Rank | Local authority | Average price June 2000 |
Average price June 2026 |
Nominal change | Real change (CPI) |
| 1 | Surrey Heath | £165,809 | £461,396 | 178.3% | 42.4% |
| 2 | Tandridge | £169,620 | £475,344 | 180.2% | 43.4% |
| 3 | Tower Hamlets | £160,503 | £456,898 | 184.7% | 45.6% |
| 4 | Hammersmith and Fulham | £254,664 | £725,562 | 184.9% | 45.8% |
| 5 | Bracknell Forest | £138,880 | £396,103 | 185.2% | 45.9% |
| 6 | West Oxfordshire | £144,906 | £416,425 | 187.4% | 47.0% |
| 7 | Woking | £150,569 | £433,790 | 188.1% | 47.4% |
| 8 | Swindon | £91,485 | £265,666 | 190.4% | 48.6% |
| 9 | Guildford | £179,926 | £523,974 | 191.2% | 49.0% |
| 10 | Windsor and Maidenhead | £197,464 | £576,992 | 192.2% | 49.5% |
In contrast, the average house price in Surrey Heath had a nominal change of 178.3% between June 2000 and June 2026. This equals a real change of 42.4% when deflated by CPI. This is the lowest increase in England and Wales and is around a quarter lower than the average.
Also in Surrey, Tandridge (180.2% nominal change), Woking (188.1% nominal change), and Guildford(191.2% nominal change) rank among the ten local authority areas with the lowest house price increases.
Greater London local authority areas, Tower Hamlets (184.7% nominal change) and Hammersmith and Fulham (184.9% nominal change) also place among areas with the lowest price increases.
This is alongside Berkshire’s Bracknell Forest (185.2% nominal change) and Windsor and Maidenhead (192.2% nominal change), West Oxfordshire (187.4% nominal change), and Swindon (190.4% nominal change).
Table: UK regions ranked by average house price increases (2000-26)
| Rank | Region or country | Average price June 2000 | Average price June 2026 | Nominal change | Real change (CPI) |
| 1 | North West | £49,743 | £219,922 | 342.1% | 126.2% |
| 2 | Wales | £50,597 | £213,162 | 321.3% | 115.5% |
| 3 | Yorkshire and The Humber | £50,465 | £207,948 | 312.1% | 110.8% |
| 4 | East Midlands | £60,111 | £240,457 | 300.0% | 104.6% |
| 5 | Scotland | £49,442 | £195,355 | 295.1% | 102.1% |
| 6 | West Midlands Region | £65,275 | £250,941 | 284.4% | 96.7% |
| 7 | England | £76,729 | £293,262 | 282.2% | 95.5% |
| 8 | East of England | £90,619 | £338,707 | 273.8% | 91.2% |
| 9 | London | £153,669 | £553,870 | 260.4% | 84.4% |
| 10 | North East | £46,362 | £165,550 | 257.1% | 82.7% |
| 11 | South West | £86,291 | £304,562 | 252.9% | 80.6% |
| 12 | South East | £116,512 | £380,380 | 226.5% | 67.0% |
| 13 | Northern Ireland | £64,292 | £202,487 | 214.9% | 61.1% |
| United Kingdom | £82,197 | £272,188 | 231.1% | 69.4% |